Why public sector efficiency?
The argument for greater efficiency in the public sector at a time of spending reductions and increased pressure on services is obvious, but the importance of efficiency goes beyond saving money.
Government output currently makes up around a fifth of Gross Domestic Product and any effort to boost economy-wide productivity must include the public sector and public services. However, productivity is only one aspect of efficiency. As the Prime Minister highlighted earlier this year, efficiency is also key to delivering a “smarter state” capable not only of delivering more for less, but better public services.
Boosting public sector productivity and creating a “smarter state” require both an evidence-based understanding of what public services have been able to deliver so far, the drivers of these outcomes and the different options available.
Since the beginning of 2014, a group of Civil Service analysts established by Dave Ramsden, Head of the Government Economic Service, and chaired by Stephen Aldridge has been building this understanding through the Public Sector Efficiency Group.
What do we mean by efficiency?
Efficiency refers to the entire process of turning public money into positive outcomes for individuals and society (as set out in the Figure 1). It goes beyond back-office savings, and means thinking about how government funds, designs and delivers frontline services. Improving efficiency does not just mean reducing spend.
It also means delivering better outcomes and more effective government, while using public money in the smartest way possible.
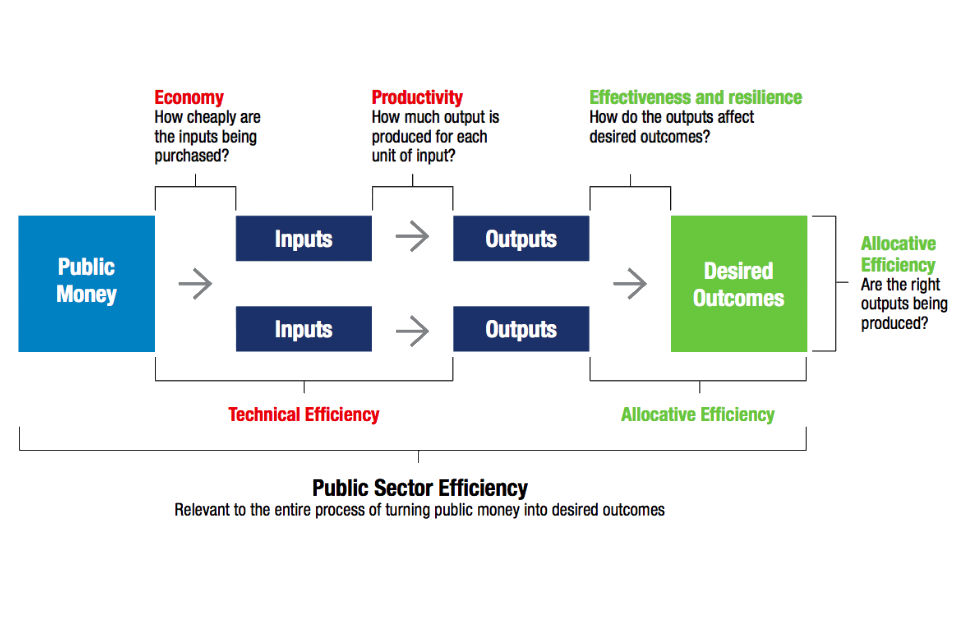
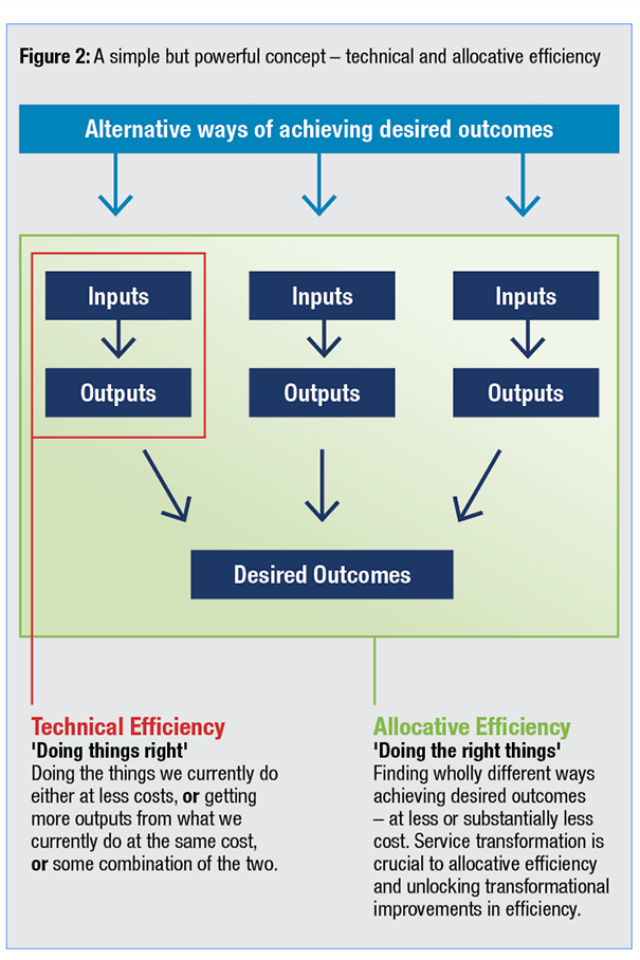
To highlight this, the Group made one concept central to its work – the distinction between ‘technical’ and ‘allocative’ efficiency (see Figure 2). Technical efficiency means doing what we do now, but better.
It means asking questions like can we purchase inputs, such as hospital equipment or teaching staff, at a lower cost without affecting quality? Can we produce more outputs, such as medical operations or A* GCSE pupils, for the resources we’re putting in?
Allocative efficiency means finding wholly different ways of achieving the outcomes we want. It requires asking further, more difficult questions: Are we doing the right things? Does this policy really work? It became clear through the Group’s work that government is very good at asking (and answering) questions about technical efficiency, but can sometimes struggle with questions about allocative efficiency.
The UK has a strong track record in measuring public sector efficiency. Ever since the independent review by Sir Tony Atkinson in 2005, the UK has been at the forefront of tracking the efficiency of government services. The Office for National Statistics, for example, publishes statistics on the productivity of public services as a whole, as well as detailed articles on education and healthcare.
The Group recognised that any efficiency metric would be subject to measurement challenges – possibly significant ones. However, these can usually be at least partially overcome provided the limitations are understood and conclusions drawn with care.
The Group’s work was always intended to do more than just measure efficiency – it was intended to facilitate constructive challenge to every part of Whitehall, help each department better understand the efficiency of their services, activities and programmes and recognise where/ how they might be improved.
What have we learned about the trends in efficiency?
The Group has surveyed evidence on both technical and allocative efficiency from the main spending departments to bring together a comprehensive analysis of trends in public sector efficiency. The Group’s final report is one of the most encompassing undertaken in recent memory – though many gaps remain.
One of the most interesting findings was the apparent break in the long run trend around 2010. Since then, outputs and/or outcomes have remained stable or improved across many government services, despite having fewer resources. Of course, that doesn’t mean this trend will continue: but it does suggest that placing hard budget constraints can increase efficiency. The box below summarises the data on the trend in productivity in the National Health Service.
Efficiency in the National Health Service
Using largely in-house monitoring data, the Department of Health (DH) has estimated that between 1975 and 2010/11, NHS England’s labour productivity rose by an average of 0.8 % per annum, much of this driven by reduced average length of hospital stay and shifting activity to day cases. This allowed fewer beds and nurses per episode, though the average need of patients in hospital increased. Between 2010/11 and 2013/14, labour productivity growth almost doubled to 1.4% per annum. A combination of pay restraint, cuts in central budgets and the abolition of some tiers of management helped deliver unprecedented savings over this period.
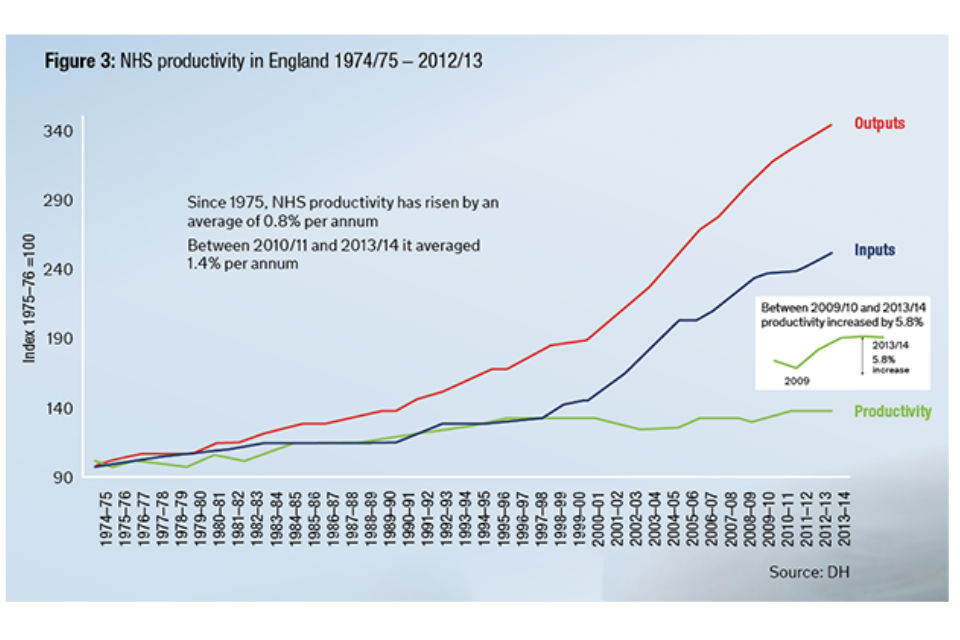
This story of the shift in productivity performance since 2010 is confirmed using data from the Office for National Statistics (ONS) and York University. ONS data also shows that from 2010 to 2013, NHS productivity has grown well above its long run trend (1.9% per annum compared to 0.8% per annum on average since 1996). The ONS index measures healthcare productivity growth across the UK and includes spending on capital, goods and services inputs, as well as labour. Note: Labour productivity is the ratio of an index of outputs to labour inputs. Outputs include a variety of measures, including in- and out-patients treated, GP consultations and prescriptions issued. These are quality-adjusted using survival rates, patient surveys and waiting times.
What have we learned about what drives efficiency?
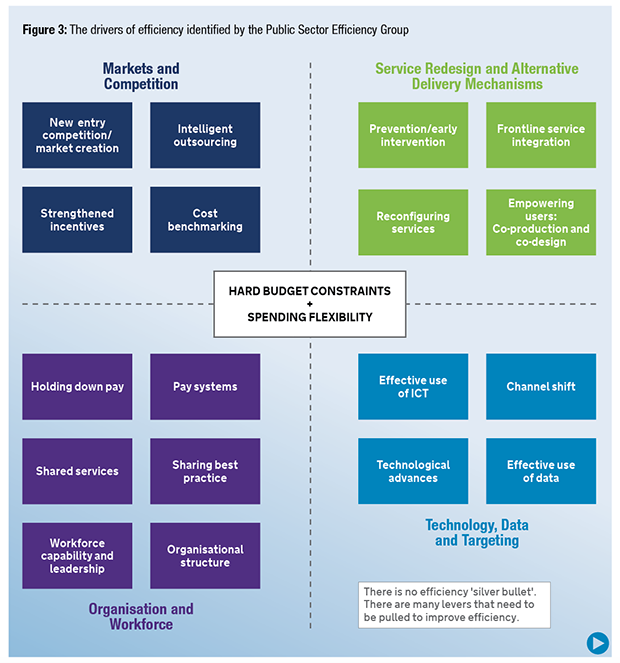
Behind the analysis of trends in public sector efficiency, the Group has built up a wealth of case studies. Through these case studies and other evidence, it became clear there were five key broad drivers of public sector efficiency improvement (see Figure 4):
- the use of markets and competition
- service re-design and alternative delivery mechanisms
- organisation and workforce drivers
- technology, data and targeting
- hard budget constraints and spending flexibility
Crucially, though perhaps unsurprisingly, there doesn’t appear to be a single key driver. Improving public sector performance relies on a number of levers being pulled simultaneously.
The more challenging part of the Group’s work was assessing the scope for further efficiency improvement. It concluded that there remains significant scope for efficiency improvement over the medium to longer term – in particular, through service redesign, the use of markets and competition and the use of new technology and data.
Embedding the approach across Whitehall
The government analytical community’s work on efficiency did not end with the production of a final report. The Group’s findings have, for example, been discussed with Permanent Secretaries at their weekly gathering and fed into HM Treasury’s plan for boosting productivity.
The Group is now taking its work further by collaborating with the Government Finance Profession to develop Value Maps – a framework being piloted that aims to help every government department analyse and visualise the entirety of its spend, assess its understanding of the efficiency of different services, activities and programmes and identify the scope for improvement.
The Group has also made all of its materials readily available to civil servants. This includes the final report and an ‘Efficiency Toolkit’ – a two-page tool bringing together the Group’s key insights into a set of practical steps for applying these to any area of government spending.
Markets and competition in action: The Prison Unit Cost Programme
The Prison Unit Cost Programme applies a cost benchmark to each public sector prison, based on overall prison costs and prison-specific attributes. The tailored benchmarks incentivise less efficient prisons to identify areas for improvement and learn from more efficient prisons. This has also been combined with intelligent outsourcing to further drive costs down. The programme aims to achieve a saving of around £300 million per annum and reduce the overall unit cost by approximately £2,200 per prison place.
For more information about the Group’s work, including a copy of its Final Report, or the ongoing work with the Finance profession, please visit the online Civil Service Learning pages or contact Stephen Aldridge: stephen.aldridge@communities.gsi.gov.uk
The authors of this article are grateful to analysts and other colleagues across departments for their invaluable contributions to the work of the Public Sector Efficiency Group.
1 comment
Comment by Heather Hukins posted on
Similar challenges face governments in other countries and jurisdictions. I have worked for several years to improve what we call efficiency (primarily referring to technical efficiency) and effectiveness (closely related to allocative efficiency).
Efficiency - Every decision is a financial decision because every decision has financial consequences. Balancing limited resources with infinite demand requires publicly funded organisations to continuously reduce or contain costs while maintaining public value. One way to do this is by improving on three dimensions – price, quality, and volume – to increase efficiency so that each unit of input delivers more of the intended outputs. Improving efficiency is not the opposite of creating public value. It is one of the ways we can maximise public value with finite resources and infinite demand.
Effectiveness - Balancing finite resources with seemingly infinite demand requires publicly funded organisations to consider actively and often whether resources are delivering as much public value as possible. Critiques tend to focus on leakage due to waste, bureaucracy and inefficiency, but some common opportunities to deliver more value lie in identifying effort that is not effective, and in shifting those resources to target better outcomes. There are four common drivers of ineffective effort: habit (doing the wrong thing because it is what we usually do); conspicuous appropriation (doing the wrong thing to be seen to do something); error (doing the wrong thing while believing it to be right); and experimentation and research (doing the wrong thing temporarily to find out whether it is right or wrong).