Crime in general has fallen, but thieves are still targeting mobile phones. The Behavioural Insights Team (BIT) has developed a risk index to keep consumers informed and even prevent crimes before they happen. Simon Ruda, Ed Bradon and David Halpern from BIT show us how they did it.
Since the early-90’s, car theft has fallen more than four-fold. In less than a generation, ‘joyriding’ has gone from being a symbol of troubled youth, to a term that most youth would not even know. Crime in general has fallen over the period, but the fall in car crime stands out as particularly dramatic. In contrast, a minority of crime-types have been more stubborn, and a handful have even risen. Amongst the crimes to have fallen more slowly is 'theft from the person', driven substantially by the theft of mobile phones.
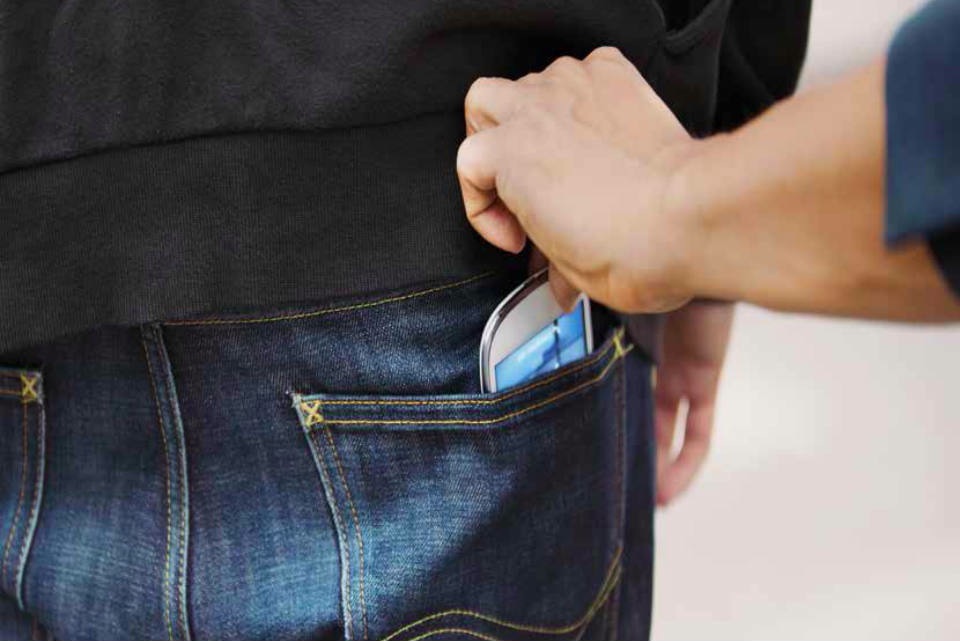
Every year, almost three quarters of a million mobile phones go missing – that’s about 1 in 50 people losing their phone every year. Given the increasing value of phones, and the amount of personal data held on them, this is a major problem. Increasingly, your mobile is also your diary, your photo album, and even your wallet.
The mobile phone has become an indispensable component of modern life. But have a think about when you last got one. You’ll have had no shortage of choice: Britons looking for a new mobile phone today can choose between at least 79 different models on the market, across 11 manufacturers, together with many networks. This choice is informed by a wealth of information on everything from design and brand appeal to screen size, battery life and operating system. But there is 1 critical area where consumers have far less information – the security and risk associated with different phones.
Value of mobile phones
In 2011, the average value of personal data on a phone was estimated to be £760. In the last 3 years, this is likely to have increased greatly.
Are some phones safer than others? The case for a ‘risk index’
The overall numbers of phone thefts masks big differences in the risk of theft of different handsets. The Police, manufacturers, and thieves all have a pretty good idea of which phones are more at risk. But until September this year, the one group that didn’t were consumers. This matters, not just as a matter of principle, but because it shapes the market – and crime.
If we look back to the fall in car crime, we can see that improved security features played an important part in making cars harder to steal. More specifically, manufacturers started making cars that were harder to steal, and one of the reasons they did this was that consumers started to care about it. And why did consumers start to care? Because of the decision by the Home Office, some 20 years ago, to release the data showing the relative theft rates of different cars, so that consumers were able to make better informed choices about the cars that they purchased. We also know, from the work of behavioural scientists such as George Lowenstein, that security and privacy are things that people do not think about or value, unless they are prompted to do so. That’s why the Behavioural Insights Team – formerly of the Cabinet Office, now a social purpose company – has been working with the Home Office and the Metropolitan Police to develop the first official risk ratio for mobile phones. Our conclusion was that, just as happened with cars, better informed consumers will not only keep their phones safer, but will also encourage manufacturers to build phones that are more secure and less attractive to thieves to steal. But to do this, we first had to find a way of establishing whether, and by how much, some phones are more likely to be stolen than others.
The Mobile Phone Theft Ratio
The Mobile Phone Theft Ratio uses data supplied by the Police to show which handsets were more likely to be stolen than others, proportionate to their market share and availability. The data that lies behind it is an analysis of thefts of over a hundred thousand mobile phones in London over the 18 months between August 2012 and January 2014, together with data on market share by phone type and manufacturer. This data has enabled us to build an index that shows which models of phone had the highest risk of theft;
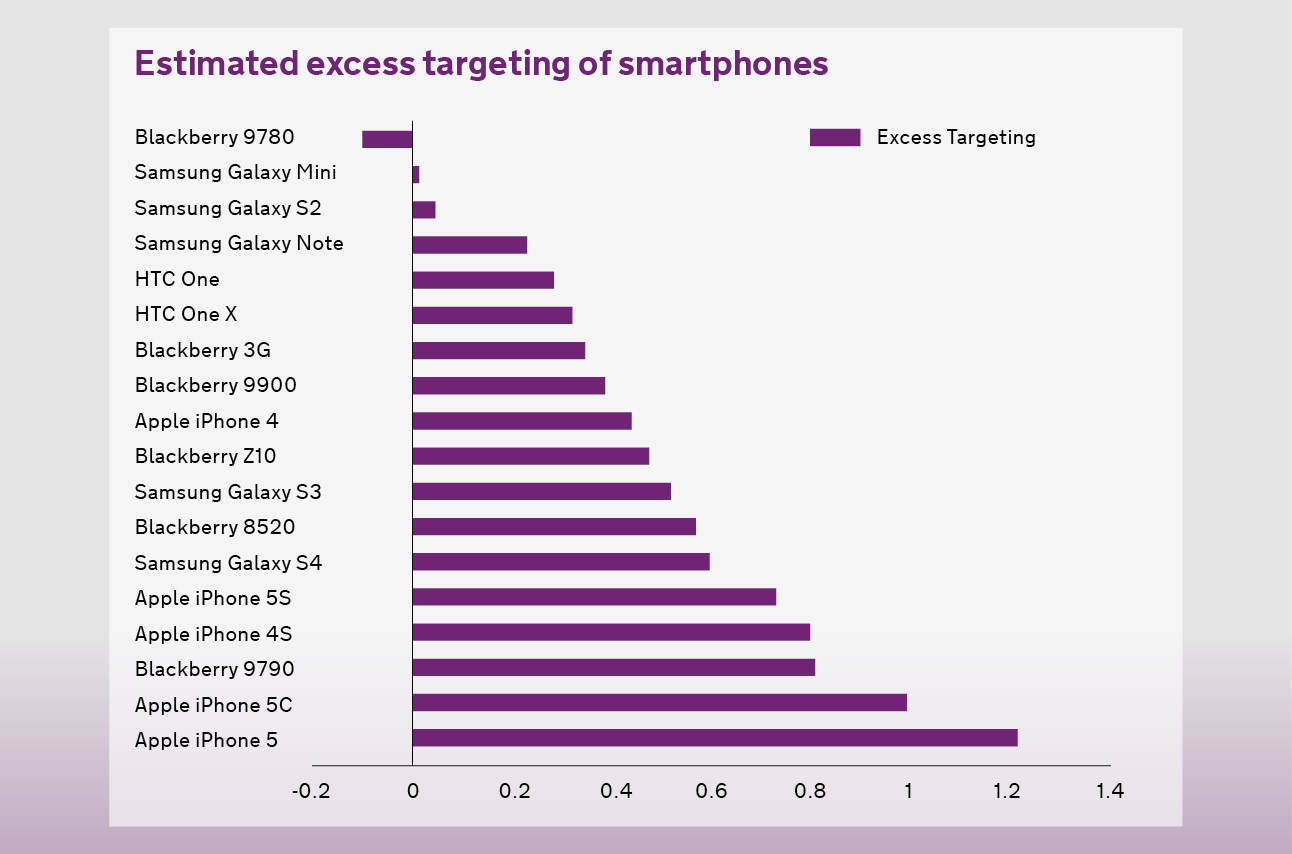
The findings were clear: models such as the Apple iPhone were most at risk. This does not mean you should not buy one. But it does mean that these phones’ attractiveness to consumers may have translated to high black market value, and that their security features at the time may have been inadequate deterrents to thieves.
Harnessing the ingenuity of manufacturers to design out crime
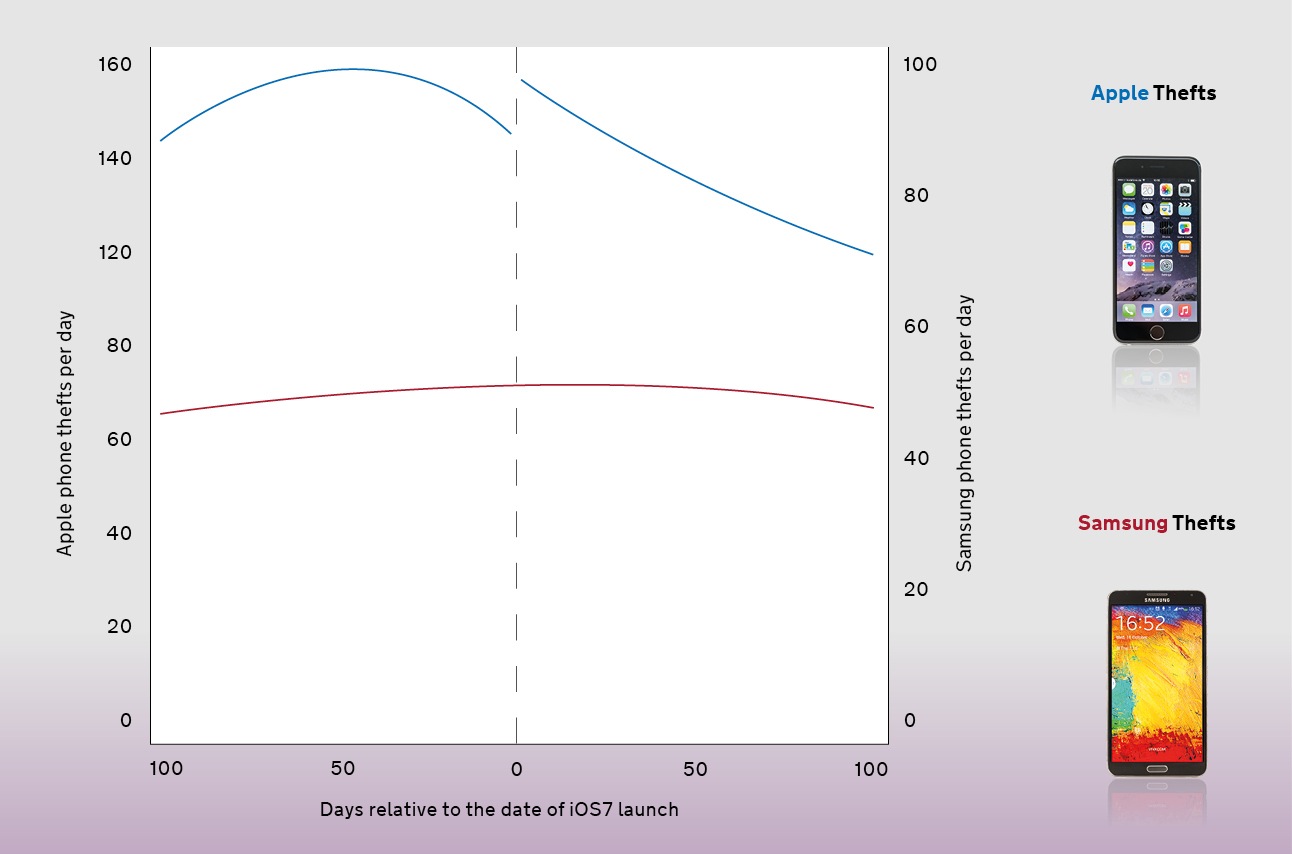
Just like cars a decade ago, the challenge facing mobile manufacturers is to build products that are both more secure and still easy to use (when did you last think about your immobiliser?). Fortunately, manufacturers are moving in this direction. PIN codes, remote tracking and data wiping are commonplace. Hardware advances have made biometric security measures such as fingerprint scanners a possibility. Leading manufacturers have also made a voluntary commitment to provide a ‘kill switch’ to new phones sold in the US from July 2015, which would remotely wipe a user’s data and render the phone inoperable to an unauthorized user. We can also start to see the impact of such features in the Met Police data during the period of our analysis. For example, we can see the impact of the introduction of iOS7 – an operating system with enhanced security functions, such as requiring consumers to opt out of using a passcode lock, rather than having to opt in – on thefts (see figure). Over the 100 days following its introduction, the theft rates of Apple phones fell from roughly double that of rival Samsung, to around half more. Thieves learnt that Apple security got harder to crack. This was towards the end of the data period of our analysis, and therefore probably too soon to see the impact of this in the Mobile Phone Theft Ratio.
Getting a phone? Lessons for consumers
What are the lessons for consumers, and for you, when you get your next phone? Here are 3 things you might do, based on our analysis of the Met Police data:
1 Use your phone’s security features. Don’t skip that PIN,or leave it set to 1111. You’ll not only keep yourself safer, you make mobiles less attractive to thieves in general.
2 Don’t leave it out! Many phones are stolen from tables and bars – you wouldn’t leave your wallet out when you go to the toilet… Also take extra care in busy sites where many people automatically take their phones out, such as coming out of the underground.
3 Ask about security features when choosing your new mobile. This is arguably the biggest thing you can do to make mobiles more secure. Not only might it guide you to a safer phone, but it’s also a direct line to manufacturers telling them to try harder to keep you safe.
Conclusion
Behavioural insights and data transparency are both powerful tools, but bringing them together can be a knock-out. For the Met Police and Home Office, it is a way of preventing tens of thousands of crimes before they have occurred, and at little or no public cost. Some mobile manufacturers were worried about the publication of a theft index, just as were some car makers a generation ago. But they also know that it’s an opportunity too.
For those manufacturers that are fast off their feet, they can offer mobiles that are more secure and that consumers will pay more for, at least at the margin. Indeed, it is thought that security improvements introduced by industry contributed to recorded theft from the person falling by 10% in the last year. In the longer-term, such innovations can lead to products that we trust, not just as phones but as engines of innovation for both economy and society. Who knows – perhaps your grandchildren will ask ‘what’s mobile theft?’ just as your kids ask ‘what’s joyriding?’
Building the Theft Index - Technical Details
To construct the ratio, we analysed a dataset containing information on every crime in which a mobile phone was stolen in London between August 2012 and January 2014. These data were cleaned to exclude errors and repetition of reporting. From this we were able to code the makes and models of phones, and to use this to create the mobile phone theft ratio.
The ratio itself is calculated by dividing a particular handset’s share of all “targeted” thefts (i.e. where the handset was plausibly targeted, such as a phone being snatched from someone’s hand) by the estimated “availability” of that phone (i.e. that handset’s share of all those in active use in London during that time). It’s important to note that availability is not the same as market share, which only tells us which phones come into use (or become available for theft) each year, and not which phones cease to be used (or become unavailable for theft). Only mobile phone providers have access to precise information on which phones are active over a period of time, and this information was not available to government.
Therefore, we needed to accurately estimate the proportion of each handset in London in use. To estimate availability, we measured the proportion of handsets in the dataset whose theft could not plausibly have been targeted (e.g. a stolen handbag containing a phone, which the thief could not have known). As these datasets are so large, we are confident that they provide an accurate representative sample for London. This allowed us to calculate an average risk of theft across all handsets, and then calculate which handsets suffered from excess risk of theft over and above the average. It also allowed us to observe the impact of security features as they were introduced to the market, like iOS7. In addition to this, we looked at whether people’s age and gender affected their likelihood of being a victim of crime, and identified where thefts were most likely to occur (e.g. nightclubs).
9 comments
Comment by Sean posted on
Typo in 9th para I think, you refer to Met Office data when I think you mean Met Police?
Comment by krisztinakatona posted on
well spotted - thank you!
Comment by Robin Jahdi posted on
Very interesting article - thanks for publishing this.
There're two more typos on the 'Estimated excess targetting of smartphones' chart: header should say 'targeting', and there's a missing 'a' on 'Blckberry 8520'.
Question about the Apple vs Samsung theft trend chart. Does the team find it beneficial to change the Y axis measurement? Not only does it obfuscate the trends, but it actually works against your message - that, post-iOS7 introduction, the gap between Apple and Samsung theft decreased in a big way. As it is currently displayed, the visual message suggests the difference is almost unchanged.
But please keep updating this - interested to see how the trends go, as the newer phones (and perhaps tablets?) are introduced.
Comment by Matthew Cliffe posted on
Not only does the differential Y axes potentially confuse the public, it also appears to have confused the authors
"Over the 100 days following its introduction, the theft rates of Apple phones fell from roughly double that of rival Samsung, to around half more."
Samsung was roughly steady at betwen 40 and 50 thefts per day.
Over the 100 days following iOS7 launch, Apple fell from c. 155 to 120 per day.
So actually a fall from roughly four times to roughly 3 times....or is it too long since I did my Statistics training??
[Good to see this data published, I just hope the minor errors can be ironed out so as not to undermine it! I doubt, however, it will enable me to persuade Mrs C not to get the latest iPhone at upgrade time :-(]
Comment by Andy J posted on
They don't change the axis scaling, they just use a different one between the two phones, regardless of time.
But - its a fair point that it does not help - having both phones on the same scale word make for an easier and more obvious comparison.
Comment by Puzzled posted on
'For those manufacturers that are fast off their feet' - I think the common parlance is 'For those manufacturers that are fast on their feet'.
Comment by Kate posted on
With many users protecting their phones with cases to avoid scratches, etc., surely there is some obfuscation of data in that opportunist thieves might not know what phone they are stealing - just that it is a smartphone based on the size and shape. If that is the case then market saturation will have an impact on the number of handsets stolen, irrespective of any security features that the manufacturers have added to the phones.....
Comment by Keith Myers posted on
Really interesting insight into easy ways to reduce a common crime.
One comment though "Since the early-90’s, car theft has fallen more than four-fold"
This can't mean car theft has fallen by 400% or that would mean the theives are giving cars back! Do you mean that it is now a 1/4 of what it was?
Comment by Aamir Nawaz posted on
Great article. Well done!