There are around 2.5 million people on health-related benefits in the UK, which costs around £15 billion per year*. Each month, around three times as many people move onto health-related benefits as move off; and the longer people are on these benefits, the less likely it is that they will return to work.
The Work & Health Unit (a joint unit set up by the Department for Work & Pensions (DWP) and the Department of Health) has been working with Policy Lab for the past 18 months on a project to create ways to support people to manage their health conditions and stay in work.
Policy Lab and the three ‘D’s
Policy Lab is an innovation team in the Cabinet Office and supports departments to use new digital, design and data (DDD) techniques to improve how they make policy. It was created as part of the open policy-making agenda. Over the last two years it has not only supported departments on real policy projects that have saved money and improved citizen experience, but also used these as test-beds to create better policy-making processes and trained up to 5,000 civil servants in new methods.
Data and digital are fairly understandable concepts in policy-making. But design? Why is it one of the three Ds?
Policy Lab believes that design approaches are particularly suited to complex issues that have multiple causes and for which there is no one, simple answer. Design encourages people to think about the user’s needs (not just the organisation’s needs), brings in different perspectives to innovate new ideas, and then prototypes (mocks them up and tries them out) to iteratively improve ideas until they find one that can be scaled up.
Policy Lab also recognises that data alone cannot solve policy problems, and has been experimenting with how to combine numerical and more human practices. Data can explain what is happening, while design research methods – such as ethnography, observing people’s behaviours – can explain why things are happening. Data can be used to automate and tailor public services; while design means frontline delivery staff and citizens will actually know about and use them. Data-rich evidence is highly valued by policy-makers; and design can make it understandable and accessible to a wider group of people, opening up policy-making in the process.
The Lab is also experimenting with new data methods.
Data science can be used to look at complex, unstructured data (social media data, for example), in real time. Digital data, such as social media data or internet searches, can reveal how people behave (rather than how they say they behave). It can also look at huge amounts of data far quicker than humans, and find unexpected patterns hidden in the data. Powerful computers can identify trends from historical data and use these to predict what might happen in the future.
Supporting people in work project
The project took a DDD approach to generating insight and then creating ideas. The team (including the data science organisation Mastodon C and design agency Uscreates) used data science techniques together with ethnography to create a rich picture about what was happening. Then it used design methods to create ideas for digital services with the user in mind, and these were prototyped and tested with users.
The data science confirmed many of the known risk factors, but also revealed some new insights. It told us what was happening at scale, and the ethnography explained why.
- The data science showed that people were more likely to go onto sickness benefits if they had been in the job a shorter time. The ethnography explained that the relationship with the line manager and a sense of loyalty were key factors in whether someone stayed in work or went onto benefits.
- The data science showed that women with clinical depression were less likely to go onto sickness benefits than men with the same condition. The ethnography revealed how this played out in real life:
- For example, Ella [not her real name], a teacher from London who had been battling with depression at work for a long time but felt unable to go to her boss about it. She said she was “relieved” when she got cancer, because she could talk to her boss about a physical condition and got time off to deal with both illnesses.
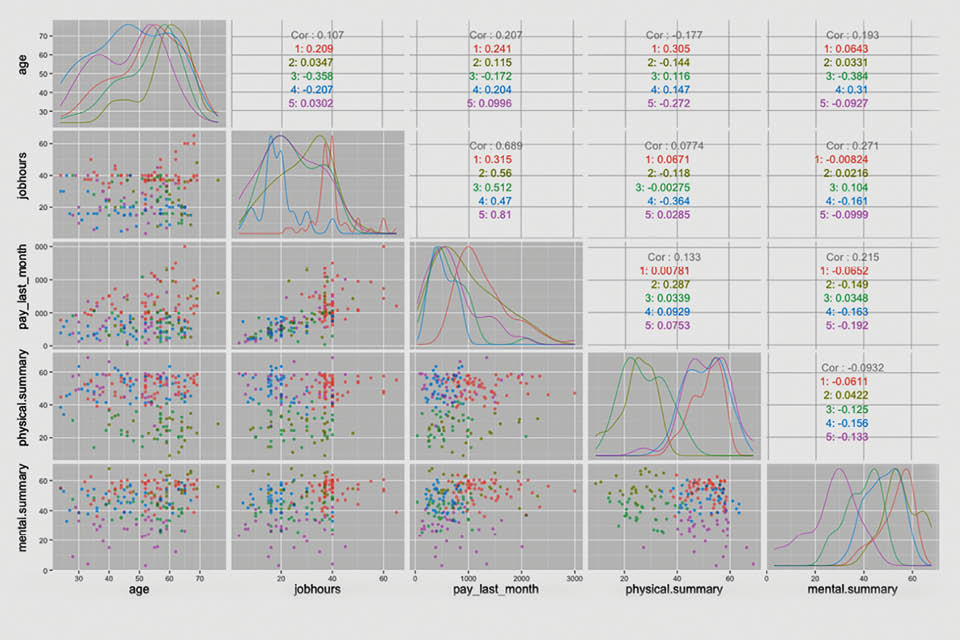
- The data science also allowed the segmentation of groups of people who said they were on health-related benefits. Firstly, the clustering revealed that two groups had average health ratings, indicating that other non-health-related issues might be driving this. Secondly, it showed that these two groups were very different (one older group of men with previously high pay and working hours; the other of much younger men with previously low pay and working hours). The conclusion was that their motivations and needs to stay in work - and policy interventions - would be different.
- The ethnography highlighted other issues that were not captured in the data but would be important in designing solutions, such as: a lack of shared information across the system; the need of the general practitioner (GP) to refer patients to other non-health services as well as providing a fit note; and the importance of coaching, confidence-building and planning.
Building a service
The Policy Lab team ran a co-design session with users, GPs, employers, Jobcentre Plus staff and policy-makers to turn this rich insight into ideas. Solutions formed around a Health and Work coach who could signpost people to different non-health services, liaise with their employer to make adjustments and build their confidence.
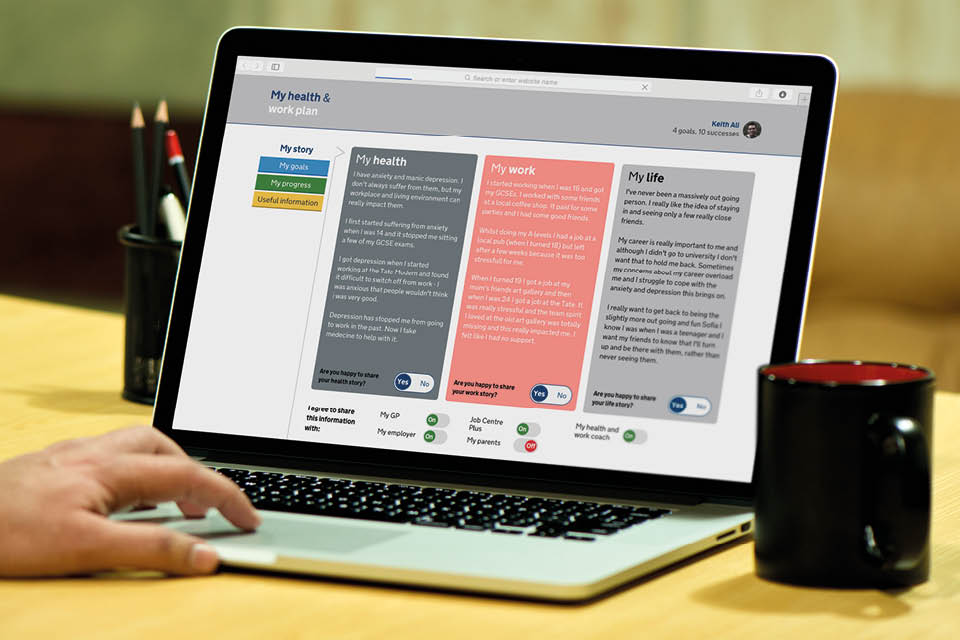
The team knew it could not build a new work and health service from scratch. So, local areas prototyped elements of it in real-life situations (‘experience prototyping’) to see how it could fit with existing services. The elements tested included: a way for employers to refer their employees to the service (Penzance); for GPs to refer their patients to it (Southend); the role of the coach (East London); and a Health & Work book for users to keep their information all in one place (Bournemouth).
Something like this would have been useful while I was still in work. I wasn’t as quick as some other staff because of my condition but they didn’t understand that. It might have helped me talk to my manager better about my health and what help I needed from him” (Response from a user in Penzance, testing the employer referral element)
The next stage was a four-day hackathon with DWP digital, taking the feedback from testing to build a digital version of the service. Policy thinking had developed by this point, as the Work & Health Unit had also been drafting the Health, Work & Disability Green Paper. The agile nature of the project (that is, characterized by short phases of work and frequent reassessment and adaptation of plans as necessary) meant that we were able to use this prototype to explore and test new priorities: a three-way conversation between employer, coach and employee and increasing self-referrals to Health & Work coaches via digital services. Bringing policy-makers, coders, UX (user-experience) specialists, frontline workers and users together meant that we were able to create a digital service with trust and empathy between employers and employees designed in.
What was learned?
There are a few key learnings from this project that the Policy Lab team has either applied to other projects (on homelessness, for example) or acted on as a result.
Firstly, there is huge power in using data science and ethnography together, with the data science giving the broad, large-scale ‘what’ and the ethnography providing the rich ‘why’.
Creating multi-disciplinary teams from the start is essential to making sure that the emerging hypotheses from the ethnographers and data scientists are shared. It means they can easily investigate further, and policy-makers can add their own expert interpretations.
Secondly, prototyping is a really important way of thinking through how a policy will be delivered from the outset. Creating a service blueprint (a plan of how someone will become aware of, join and use a service), ‘experience prototyping’ and testing a digital version gets policy-makers to think about how their ideas will actually work in practice when delivered by the frontline and experienced by citizens.
Finally, there are a few practical issues to consider, including giving external contractors access to government data, and getting non-data expert policy-makers to understand the potential for data science. The data science teams in Government Digital Service are leading a programme of work to increase data science skills, capability among the analyst community, and data literacy amongst policy-makers so they can ask for it.
Policy Lab itself has developed a range of workshops tools and techniques that can bring analysts and non-data-literate policy-makers together to help understand the potential of data, where it is generated from and how it could be used.
Read more about Policy Lab and its work at: https://openpolicy.blog.gov.uk/
* Black, C. and Frost, D. (2013) Health at Work: an independent review of sickness absence; Annual Report of the Chief Medical Officer.
Recent Comments