Introduction
Productivity, or how well an economy takes inputs and turns them into useful outputs, is important. Paul Krugman, the Nobel-Prize-winning economist, describes this importance as, “productivity isn’t everything, but in the long run it is almost everything”.
Improving the UK’s productivity is a priority for this government. Over the long-term, improving productivity in the economy is the best way to increase pay and improve living standards. For individuals, greater productivity means higher wages; for government, by supporting wages and profits, improving productivity increases tax receipts and in turn the Government’s ability to provide public services.
As the Chancellor said in his recent Mansion House speech: “Productivity is the elixir that raises incomes and living standards, and it must be a national priority to make every learner more skilled; every worker more productive; every business more competitive; and every public service more efficient. That is the route to higher wages, higher quality public services, and a brighter future.”
Improving the UK’s productivity will be a challenge. As the following charts show, the UK, like many other developed economies, has suffered a slowdown in productivity since the financial crisis and overall levels of productivity lag those in most other G7 countries. However, there are bright spots, with highly productive firms in all regions and across all sectors of the economy.
Chart 1
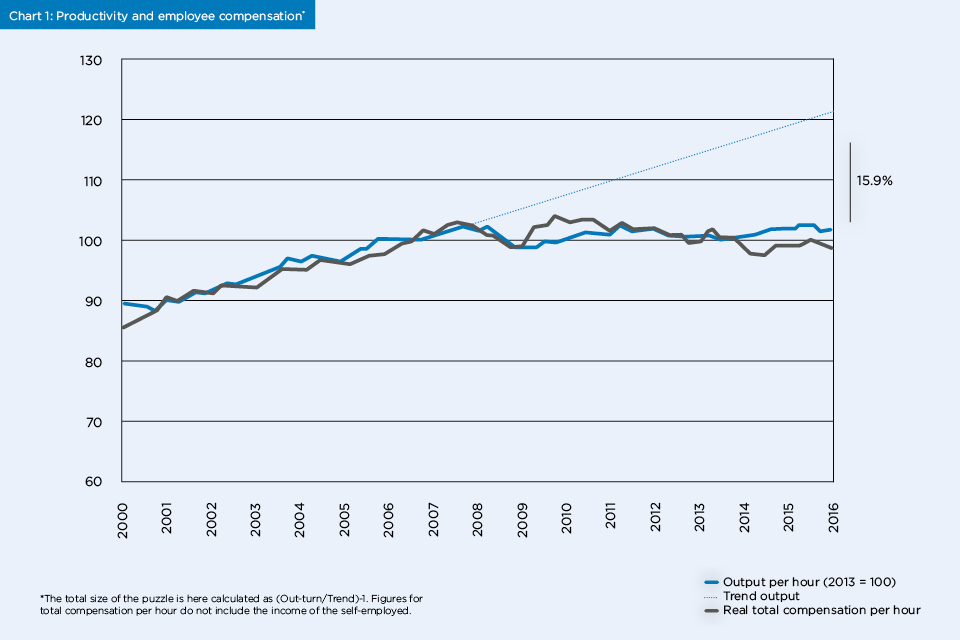
UK productivity has stagnated since the 2007 financial crisis, having remained broadly unchanged since the end of 2007. The gap between current productivity and where productivity would be, based on the pre-crisis trend, currently stands at around 17%. This represents approximately £300 billion in additional GDP, or almost £15,000 per household. While growth rates in the immediate run-up to the financial crisis may have been unsustainable, there is no doubt that productivity growth in the decade since has been very low in comparison to the 15 years before.
There has been considerable debate on the source of the UK’s productivity ‘puzzle’, and it is unlikely that there is a single underlying cause. Research has pointed to the most likely contributing factors, including: specific problems in certain sectors such as oil and gas and finance; the financial crisis affecting the allocation of resources within the economy; the low cost of labour pushing firms into substituting away from capital to labour; and issues with how we measure GDP – this is especially important in an increasingly digital economy where many new innovative services are ‘free’ to the consumer and do not show up in the productivity numbers.
Chart 2

The UK’s recent performance contrasts strongly with productivity growth over the past few hundred years. Such periods of low productivity growth are relatively rare in peacetime. That said, arguably it is the past few hundred years that are unusual, with productivity growth virtually non-existent before the advent of the Industrial Revolution. Some economists, including Robert Gordon, argue that our recent productivity slowdown represents a “reversion to the mean”, caused by us having exploited all of the most easily available ideas. Even if this is the case, and many disagree, there is a huge amount of potential for productivity growth in the UK if it is to catch up with the most productive developed economies.
Chart 3
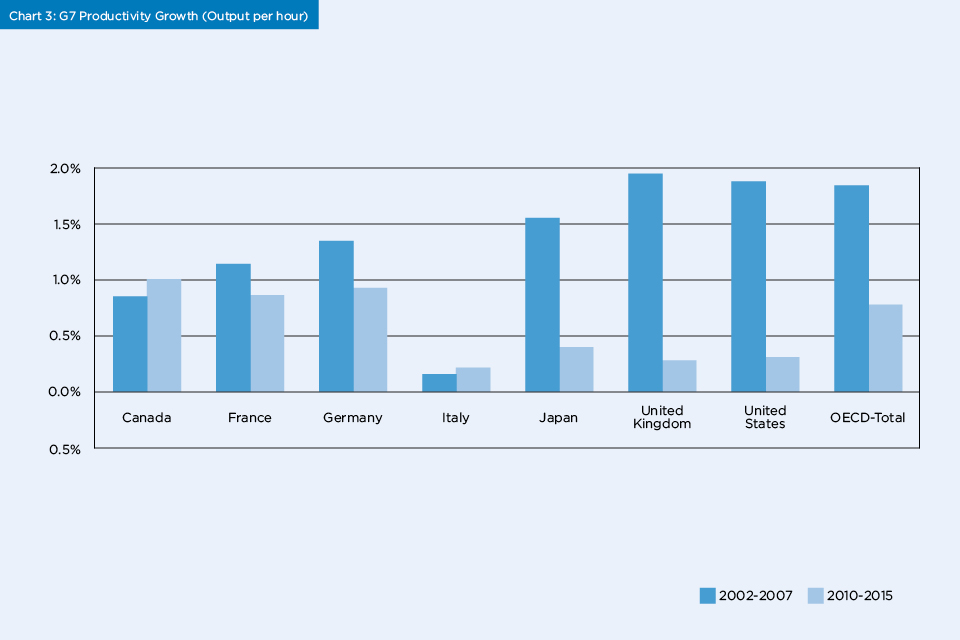
However, it’s not just the UK that has faced productivity challenges. Productivity growth has stagnated across the OECD, with average growth falling from 1.8% between 2002 and 2007, to 0.8% between 2010 and 2015. With this, there are some clear differences in performance. In the case of the UK and the US, the recovery has been primarily driven by strong employment growth rather than productivity increases. Finally, it is worth noting that these figures reflect productivity growth rates rather than productivity levels. Many of these countries had a lead over the UK in productivity before the financial crisis, which has increased since. Currently, productivity in Germany is 35% greater than the UK, with the US and the G7 averages being 30% and 18% ahead, respectively.
Chart 4
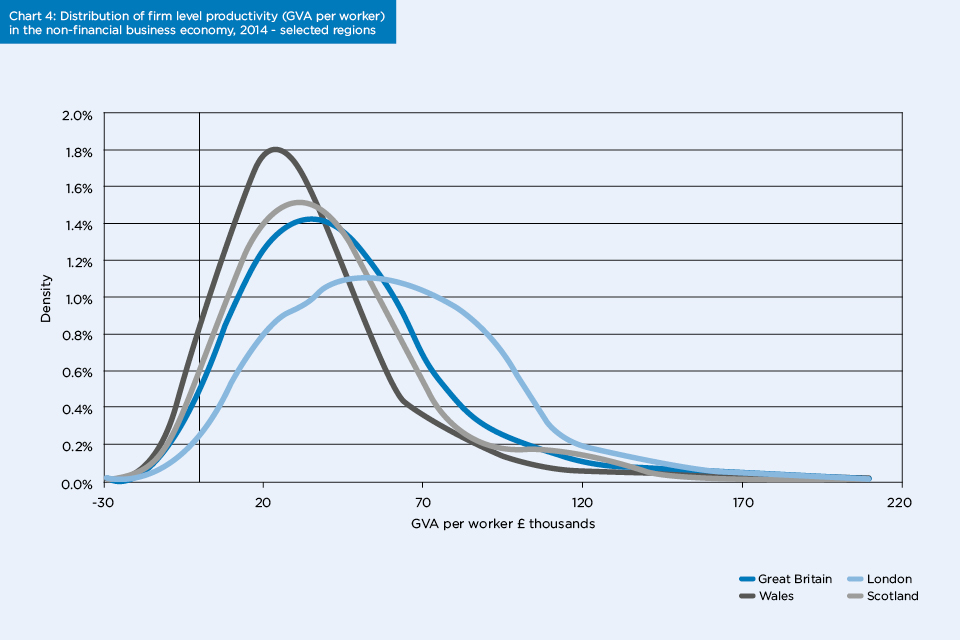
Considerable variation in productivity levels exists across the UK, and there are generally greater differences within regions than between them. This chart shows the distribution of productivity across firms in selected UK regions. London is clearly an outlier, with significantly stronger average productivity than the rest of the country, and more than 35% of London firms have a GVA* per worker of above £70,000. However, there are firms with high productivity in every part of the UK, with Scotland and both the West Midlands and East of England (not shown) all having around 15% of firms with GVA per worker higher than £70,000.
* Gross value added (GVA) is the measure of the value of goods and services produced in an area, industry or sector of an economy.
Chart 5
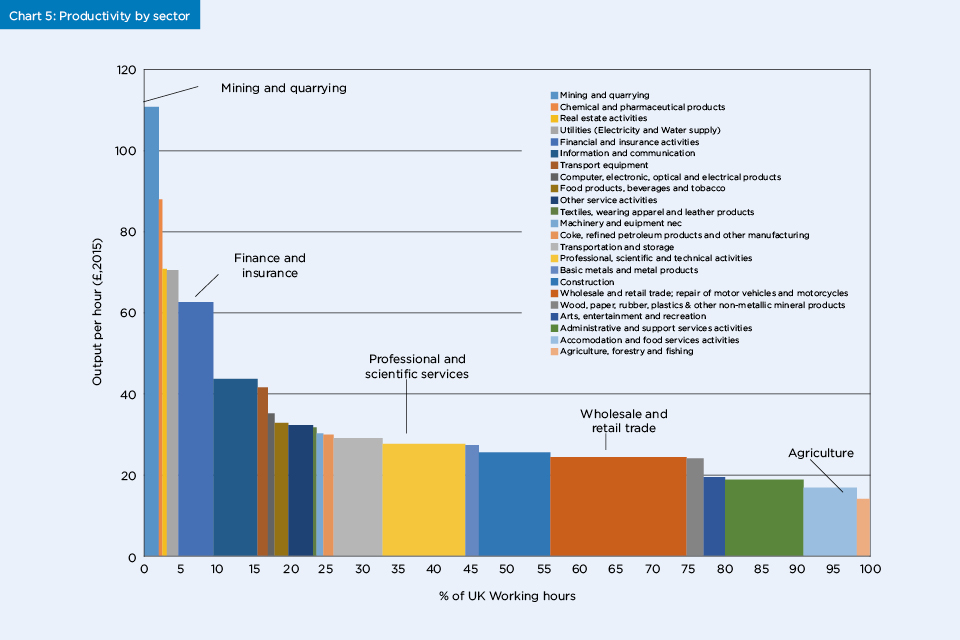
There is considerable variation in productivity across UK sectors, with some of the most productive sectors being relatively small (like financial services and pharmaceuticals). The largest proportion of hours is worked in sectors with relatively low productivity, such as retail and administrative services. There is also considerable variation within sectors. The top 10% of firms in each industry can be as much as five times as productive as the bottom 10% (2). There is evidence (3) that the difference between firms within sectors, particularly in service sectors, is getting bigger over time, and that diffusion of ideas, technologies and business practices is not diffusing from the ‘best to the rest’ as quickly as it once was, meaning that the best firms are accelerating away from rest.
Conclusions
There are a number of schools of thought on what needs to be done to improve the UK’s productivity performance. These include supply-side reform that improves competition and enables markets to work as effectively as possible; and increased investment in infrastructure that can support better connections between firms in a region and increase the size of a local labour market by allowing people to travel to work over a wider area – driving ‘agglomeration effects’.
Others suggest increasing levels of investment in tangible and intangible assets and R&D. UK spend on investment as a share of GDP is one of the lowest in the OECD and although the UK punches above its weight as a research nation, it invests a relatively small share of GDP in research and innovation compared with similar nations. Many cite the importance of improving basic skills, where the UK also performs relatively badly in comparison with other developed economies. More recently, economists such as Nicholas Bloom and John van Reenen(4) have highlighted the importance of good management in the productivity of firms, especially tackling the UK’s long tail of firms with very poor productivity.
The Government has already put policies in place to tackle many of the areas highlighted above. These include a £23 billion National Productivity Investment Fund to support investment in transport, housing and digital infrastructure as well as R&D; the introduction of the Apprenticeship Levy to incentivise firms to invest in the skills of their staff; alongside reforms to technical education and £13 million of seed funding for the Productivity Leadership Group that supports firms in adopting the best business and management practices.
Looking ahead, the Industrial Strategy is a key part of the Government’s plan for addressing the productivity challenge. As discussed in more detail elsewhere in this issue of Civil Service Quarterly, it will continue to develop the evidence base to understand the challenges facing the economy and use this to set out policies that drive growth across the country. While the UK faces a difficult productivity challenge, the gains from even small improvements are great. Even if - as some think - growth is slowing across the developed world, there is huge potential for the UK to catch up with the most productive economies.
(1) The total size of the puzzle is here calculated as Out-turn/Trend. Figures for total compensation per hour do not include the income of the self-employed.
(2) Building the evidence base for productivity policy using business data linking. Criscuolo, C., Haskel, J., and Martin, R. (2003), Economic Trends 600.
(3) Frontier Firms, Technology Diffusion and Public Policy - Micro Evidence from OECD Countries. Dan Andrews, D., Criscuolo, C., Gal, P.N. (2015), OECD Paris.
(4) Management Practice & Productivity: Why they matter. Bloom, N., Dorgan, S., Dowdy, J., Van Reenen, J. (2007).
Recent Comments