The Blue Book from the Office for National Statistics (ONS) describes economic activity in the UK. This year, for the first time, it will include spending on prostitution and drugs. Peter Patterson, the Deputy Chief Economic Advisor at the ONS, describes how they calculate the figures in the Blue Book and what they mean for the UK economy.
Mention the UK national accounts and, even if you know what they are, sex and drugs do not immediately spring to mind. But they did this year as the Office for National Statistics produced a bumper package of improvements to the key economic figures that are devoured eagerly by policymakers, analysts and the media.
The national accounts provide the essential framework for producing many of the key statistics on the economy that appear in the media every day. As well as familiar numbers, such as the rate of economic growth measured by changes in GDP, the national accounts offer a rich mine of information on a huge range of transactions carried out by households, companies, and government. These are vital for policymakers, and anyone interested in understanding how the economy is performing.
The national accounts in the UK and abroad are produced according to a rigorous set of international accounting standards. These are updated every 15-20 years in order to keep pace with changes in the structure of the economy and in patterns of economic behaviour, and to ensure full international comparability.
The latest version is legally mandated through the European System of Accounts 2010 and other statistical manuals (ESA2010). International consistency lies behind further requirements on EU members to improve and harmonise statistics in a number of areas. One of these - spending on illegal drugs and prostitution - particularly caught the media’s attention. Some activities may be illegal in the UK, but that is not the case everywhere. Comparability between nations dictates that all countries include it in their GDP figures.
In the UK, the national accounts are revised each year in the annual Blue Book exercise. This is always a demanding process, involving a myriad of surveys and administrative data sources, and where conflicting information has to be reconciled and ‘balanced’. The incorporation of ESA2010, as well as some significant improvements to the way investment and inventories figures are produced, has made this year’s Blue Book all the more challenging.
Where a complete set of data cannot be readily identified, figures are estimated using the most relevant information available. ONS desk research (please note the italics for emphasis!) into the numbers of prostitutes and the price of drugs yielded the result that spending on these illegal activities in the UK contributes up to £10 billion a year to the level of GDP. Another requirement to measure households’ spending on new cars using discounted rather than list prices entailed the use of “What Car” magazine as a prime data source. This research further uncovered the need to apply bigger discounts for cars with extras such as metallic paint. The most substantive change to the new figures results from the inclusion of spending on research and development as part of investment, requiring detailed modelling and a number of data sources. This adds on average £18 billion a year to the level of GDP.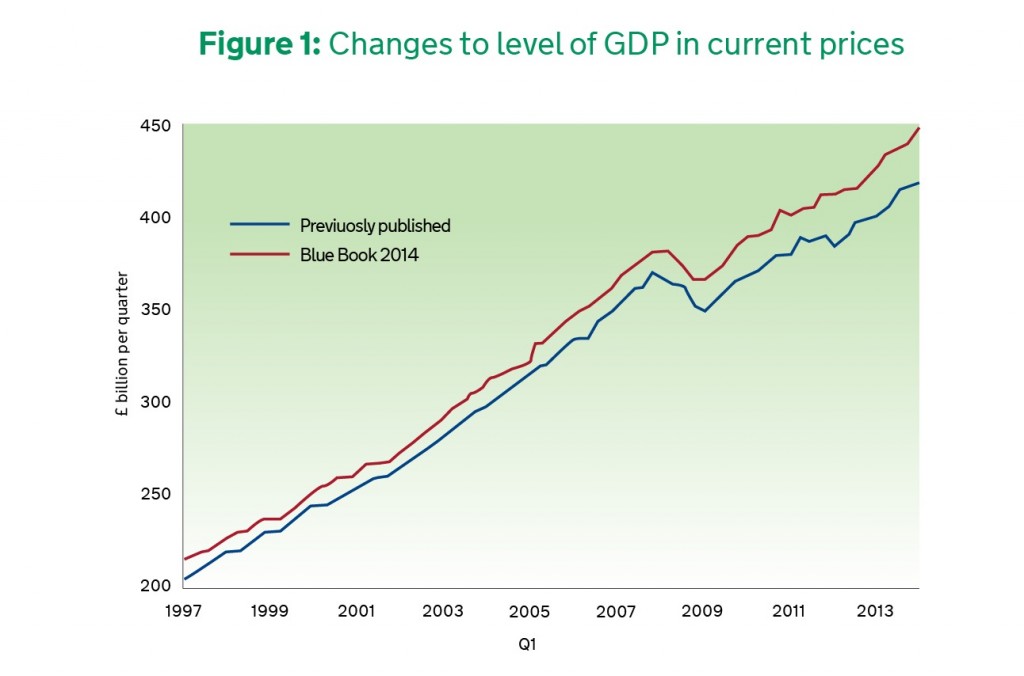
In view of the complexity and number of changes, ONS put together a comprehensive communications programme to ensure that users were fully informed about the changes that are being introduced and their impact on key economic indicators. Through publication of a regular series of articles since late 2013, ONS has explained the changes carefully, made clear the impact of individual items, and provided headline figures as soon as they were available. A formal communications plan, updated on a weekly basis over a period of several months, served to minimise the risk of confusion about a complex package of revisions to key data. This approach has been welcomed by key users and is widely regarded as exemplary among other European statistical institutes.
Economic impact of Blue Book 2014 changes
The main national accounts dataset was published on 30 September, and the Blue Book itself will add further detail on 31st October 2014. By expanding coverage, the overall effect has been to raise the level of GDP by around £50 billion a year – some 4%. The ESA2010 changes account for about half of the total increase.
The level of GDP is important because it determines, either directly or indirectly, a number of important government transactions such as the UK’s payments into the EU budget. It is also used as a benchmark to reference cash figures against the size of the economy – for instance the level of spending on defence and overseas aid, and the public sector’s outstanding debt, will now be slightly smaller when expressed as a percentage of GDP.
Economic policymakers and commentators are most interested in the growth of the economy, measured by the movements in real GDP. In fact, the overall path of economic growth has not changed substantially. The average rate of real GDP growth since 1997 has gone up slightly – from 1.9% to 2.0% a year – primarily as a result of the ESA2010 changes. Within this figure, there are much bigger revisions in a few individual years. And there has been a substantial upward revision to the path of business investment which is now seen to have risen strongly since 2010.
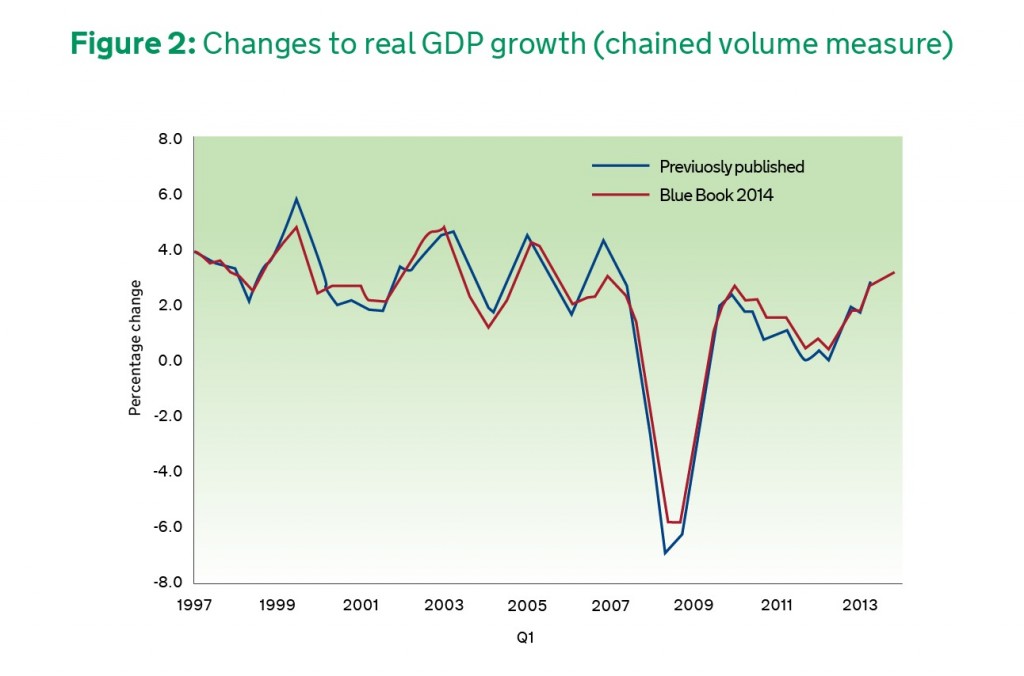 Interest has focused particularly on changes to the figures for recent y ears. The economic downturn in 2008-2009 is now slightly shallower than previously estimated. The peak-to trough fall in output during the recession has been revised from 7.2% to 6.0%, but it remains the deepest UK downturn since ONS records began in 1948. While the subsequent recovery is now faster than shown in previous estimates, it is still the slowest on record. There is no single factor behind the upward revisions to GDP growth over the period since 2008, although improvements to the measurement of investment spending and the incorporation of new information have both contributed. The addition of spending on neither R&D nor illegal activities has added significantly to GDP growth.

...and so to Blue Book 2015
Updating the national accounts over the last eighteen months has been an exciting and challenging time for ONS. The resulting picture of the UK economy is based on statistics that are more relevant to the economic structure as it stands in 2014, incorporating substantial and long awaited improvements to the way it is measured. However, the economy continues to evolve, and there is no time to rest. Just as with the metaphorical painting of the Forth Railway Bridge, no sooner is one Blue Book completed than it starts all over again. Work is already well under way on Blue Book 2015 – although ONS cannot promise anything as newsworthy as measuring illegal activities.
2 comments
Comment by naltrexone posted on
I find that these new data's important for people.
Comment by Marisol posted on
An innovative way indeed of the EU to make its member states look good economic-wise http://www.capitalistbanter.com/?p=1683